Quartalsbericht

Carmignac P. Emerging Patrimoine: Letter from the Fund Managers
-
+6.6%Net return of Carmignac Portfolio Emerging Patrimoine
F EUR Acc in 2023 (year to date from 31/12/2022 to 30/06/2023).
-
1stCarmignac P. Emerging Patrimoine
F EUR Acc is ranked 1st quartile within its Morningstar category (Global EM Allocation) for its return over 1, 3 and 5 years.
-
+4.7%5-year annualized performance
versus +2.5% for the reference indicator over the period.
Carmignac P. Emerging Patrimoine gained +0.93% in the second quarter of 2023, while its reference indicator1 was up +1.38%. Since the beginning of the year, the Fund has recorded a performance of +6.6%, compared with +3.5% for its performance indicator (40% MSCI Emerging Markets NR USD (dividends net reinvested) + 40% JP Morgan GBI-EM Unhedged (EUR, coupons reinvested) + 20% ESTER capitalised, rebalanced quarterly).
Quarterly Performance Review
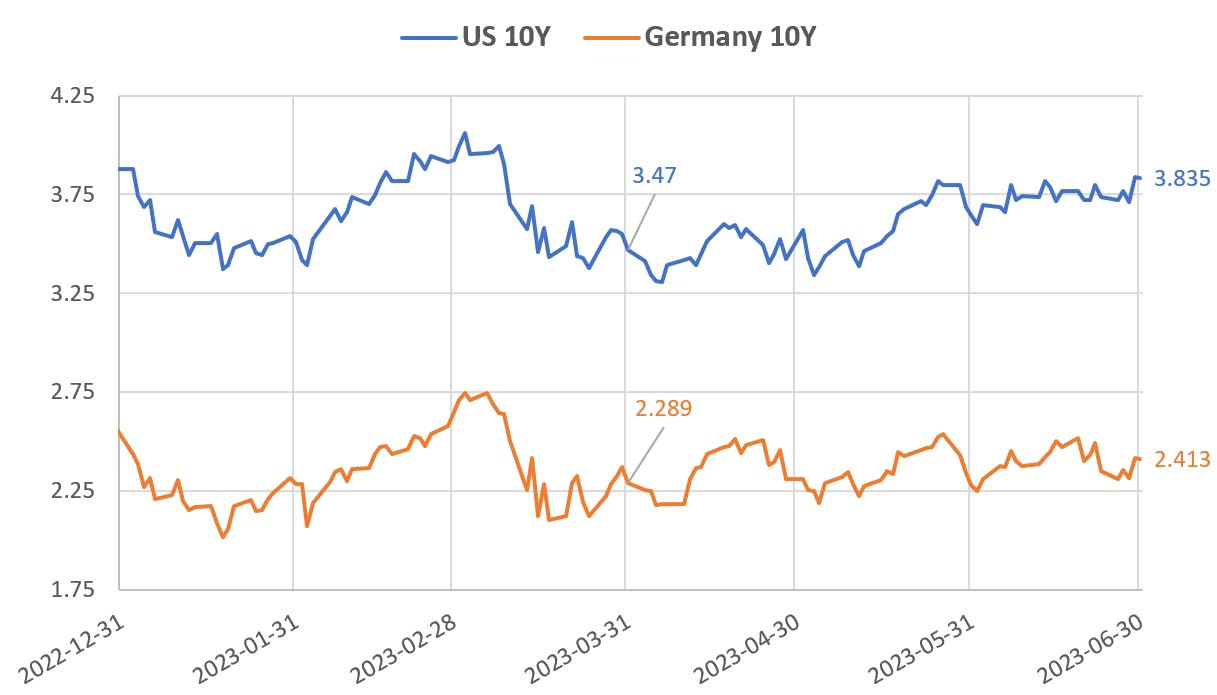
The second quarter has been characterized by a strong bullish sentiment in risky markets as well as higher global rates. The 10Y Treasury went from around 3.5% to over 3.8%, while the MSCI World added 3.7% of performance.
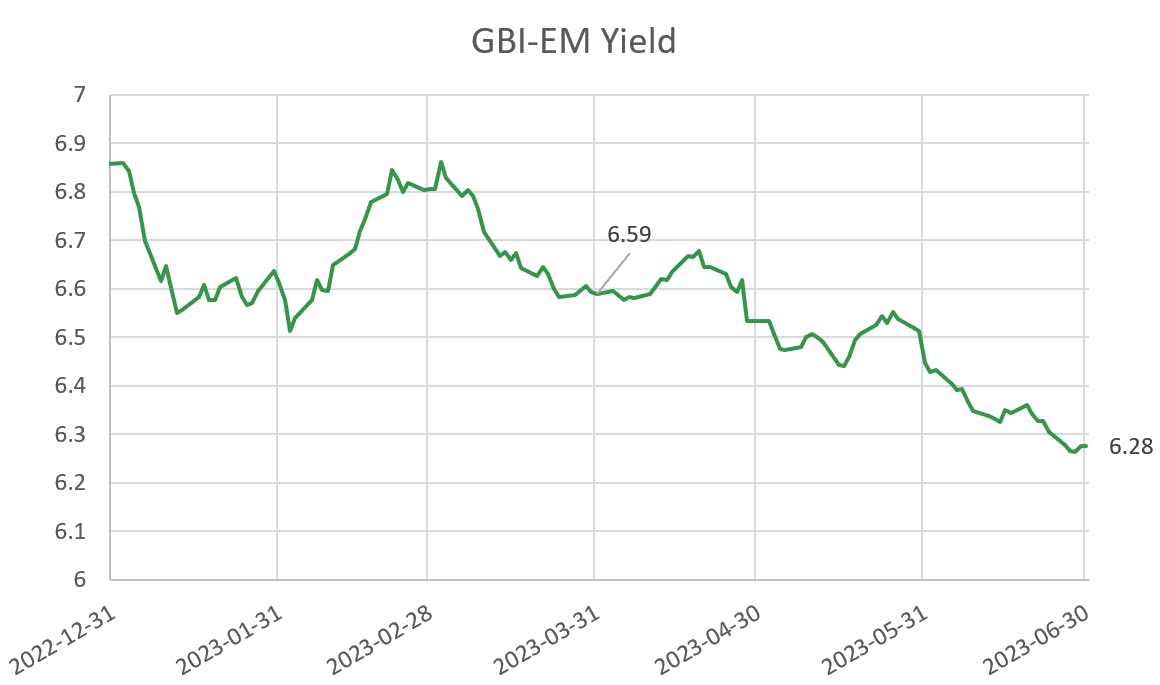
In terms of local rates we have continued to see a slowdown in the EM inflation (as well as DM inflation). In this context the local bonds performed particularly well with the GBI-EM index’s Yield dropping by 31 basis points over the quarter. We also saw the first rate cut in the EM universe this quarter with Hungary cutting twice by 100bps each time its overnight rate. We think that a number of countries are likely to follow in the next 2 quarters, such as Brazil, Chile, and Czechia.
Sources : Carmignac, Bloomberg, 30/06/2023.
Furthermore, FX despite the lower rates in EM retained a strong real carry and continued to attract investors with the exception of Asia suffering from its negative carry. We also saw that the political noise in Israel and South Africa (as well as power issues) significantly affected these currencies. For the sovereign credit we have seen a good performance with the EMBIGD index as a whole, but the EMBIGD HY outperformed with a compression of spreads by 60bps over the period.
1J.P Morgan EMBIG Diversified index hedged in EUR ;
2J.P Morgan EMBIG HY Diversified index hedged in EUR.

In the Equity space we had a disappointing quarter, in particular when looking at US or European Equities. Effectively China, a big weight in the index, dropped by 10.8% in Q2; a disappointing easing and lack of monetary intervention means that growth will not accelerate as much as was anticipated by the markets at the start of Q1 2023.
Sources : Carmignac, Bloomberg, 30/06/2023.

Sources : Carmignac, Bloomberg, 30/06/2023.
What have we done in this context
In this context we have benefitted from the Local Rates rally in the CZK, HUF, MXN and BRL curves. Following the rally we started to reduce as large interest rate cuts are starting to get priced, and the usual correlation between DM rates and these Local Curves seems to have broken during this quarter. In particular we have reduced the CZK, BRL and MXN rates.
In the FX space we continue to enjoy the carry and performance of EM FX currencies. Like in the previous quarter we have been long HUF, CZK, BRL, and MXN. During the quarter we reduced our HUF after its strong rally and as the central bank started to cut rates at a steep pace. We also used the weakness in ILS and ZAR to enter into tactical positions.
For the sovereign credit following the strong performance of the HY we took the chance to reduce the exposure of the fund while keeping our more IG names. Another important event was our purchase of Turkey CDS to protect the book but which paid off as Erdogan won the elections where we also reduced the protection. In terms of Equity we remained defensive during the quarter accelerating in the month of June our purchase of protective positions.
Outlook / How is the portfolio prepared for the following months
Looking forward we still expect a recession to hit the global economy: high rates are eating at demand an effect we are already largely seeing it in the EM world. Furthermore, China which last quarter was seen as launching a potentially large stimulus to boost growth, is showing that it is unwilling to repeat the policies of the past thus removing a possible source of global growth.
This view of recession and high rates is reflected in our portfolio construction, namely a large reduction of risk assets. We also remain focused on duration with the view that a recession would force DM central banks to cut rates and thus enable further cuts in the EM world.
This leaves us with EM FX which offer carry while having a central bank ready to defend the currency such as the CZK and the INR, as well as tactical/opportunist investments. In Local Rates we are ready to re-engage in the hikers notably in the BRL or HUF once the FED or ECB have paused and EM central banks can accelerate their cutting cycles. In Credit we remain cautious with protection against our HY names, and will keep our positioning light and focused on the IG space. Like for Credit in Equity we are going to remain defensive.
1Since the beginning of the year, the Fund has recorded a performance of +6.6%, compared with +3.5% for its performance indicator (40% MSCI Emerging Markets NR USD (dividends net reinvested) + 40% JP Morgan GBI-EM Unhedged (EUR, coupons reinvested) + 20% ESTER capitalised, rebalanced quarterly).
Carmignac Portfolio Emerging Patrimoine F EUR Acc
Empfohlene Mindestanlagedauer
Geringstes Risiko Höchstes Risiko
AKTIENRISIKO: Änderungen des Preises von Aktien können sich auf die Performance des Fonds auswirken, deren Umfang von externen Faktoren, Handelsvolumen sowie der Marktkapitalisierung abhängt.
ZINSRISIKO: Das Zinsrisiko führt bei einer Veränderung der Zinssätze zu einem Rückgang des Nettoinventarwerts.
KREDITRISIKO: Das Kreditrisiko besteht in der Gefahr, dass der Emittent seinen Verpflichtungen nicht nachkommt.
RISIKO IN VERBINDUNG MIT SCHWELLENLÄNDERN: Die Bedingungen in Bezug auf die Funktionsweise und die Überwachung der Schwellenländermärkte können sich von den für die großen internationalen Börsenplätze geltenden Standards unterscheiden und Auswirkungen auf die Bewertung der börsennotierten Instrumente haben, in die der Fonds anlegen kann.
Der Fonds ist mit einem Kapitalverlustrisiko verbunden.
Carmignac Portfolio Emerging Patrimoine F EUR Acc
| 2014 | 2015 | 2016 | 2017 | 2018 | 2019 | 2020 | 2021 | 2022 | 2023 |
2024 (YTD) ? Year to date |
|
|---|---|---|---|---|---|---|---|---|---|---|---|
| Carmignac Portfolio Emerging Patrimoine F EUR Acc | +5.95 % | +0.83 % | +10.46 % | +8.00 % | -13.80 % | +19.17 % | +21.06 % | -4.61 % | -9.00 % | +8.18 % | +2.12 % |
| Referenzindikator | +9.38 % | -5.09 % | +13.97 % | +10.58 % | -5.84 % | +18.23 % | +1.51 % | +1.61 % | -8.39 % | +6.65 % | +4.34 % |
Srollen Sie nach rechts, um die ganze Tabelle zu sehen
| 3 Jahre | 5 Jahre | 10 Jahre | |
|---|---|---|---|
| Carmignac Portfolio Emerging Patrimoine F EUR Acc | -2.95 % | +5.08 % | +3.74 % |
| Referenzindikator | -0.53 % | +2.45 % | +3.67 % |
Srollen Sie nach rechts, um die ganze Tabelle zu sehen
Quelle: Carmignac am 28/06/2024
| Einstiegskosten : | Wir berechnen keine Einstiegsgebühr. |
| Ausstiegskosten : | Wir berechnen keine Ausstiegsgebühr für dieses Produkt. |
| Verwaltungsgebühren und sonstige Verwaltungs- oder Betriebskosten : | 1,16% des Werts Ihrer Anlage pro Jahr. Hierbei handelt es sich um eine Schätzung auf der Grundlage der tatsächlichen Kosten des letzten Jahres. |
| Erfolgsgebühren : | 20,00% wenn die Anteilsklasse während des Performancezeitraums den Referenzindikator übertrifft. Sie ist auch dann zahlbar, wenn die Anteilsklasse den Referenzindikator übertroffen, aber eine negative Performance verzeichnet hat. Minderleistung wird für 5 Jahre zurückgefordert. Der tatsächliche Betrag hängt davon ab, wie gut sich Ihre Investition entwickelt. Die obige aggregierte Kostenschätzung enthält den Durchschnitt der letzten 5 Jahre oder seit der Produkterstellung, wenn es weniger als 5 Jahre sind. |
| Transaktionskosten : | 0,71% des Werts Ihrer Anlage pro Jahr. Hierbei handelt es sich um eine Schätzung der Kosten, die anfallen, wenn wir die Basiswerte für das Produkt kaufen oder verkaufen. Der tatsächliche Betrag hängt davon ab, wie viel wir kaufen und verkaufen. |