
Carmignac Portfolio Merger Arbitrage: Letter from the Fund Managers
Dear Investors,
During the last quarter of the year, our Carmignac Merger Arbitrage (I share class EUR Acc) achieved a performance of 1%, while Carmignac Merger Arbitrage Plus (I share class EUR Acc) rose 1.1%.
In the last quarter, M&A activity showed a real rebound compared with the previous quarter. Indeed, 86 M&A deals announced in the US, Europe and Asia during Q4 2023 were eligible for our portfolio, which was up 32% on the previous quarter. As usual, the US remains the largest market with 48% of the total, with Europe and Asia sharing the remainder with 26% and 27% each. The average deal size is $6 billion in the US, compared with around $2 billion in Europe and Asia. When we look at M&A activity by value, the upturn is even more notable, with a total of $340 billion worth of deals announced in the last quarter, almost double the figure for the previous quarter.
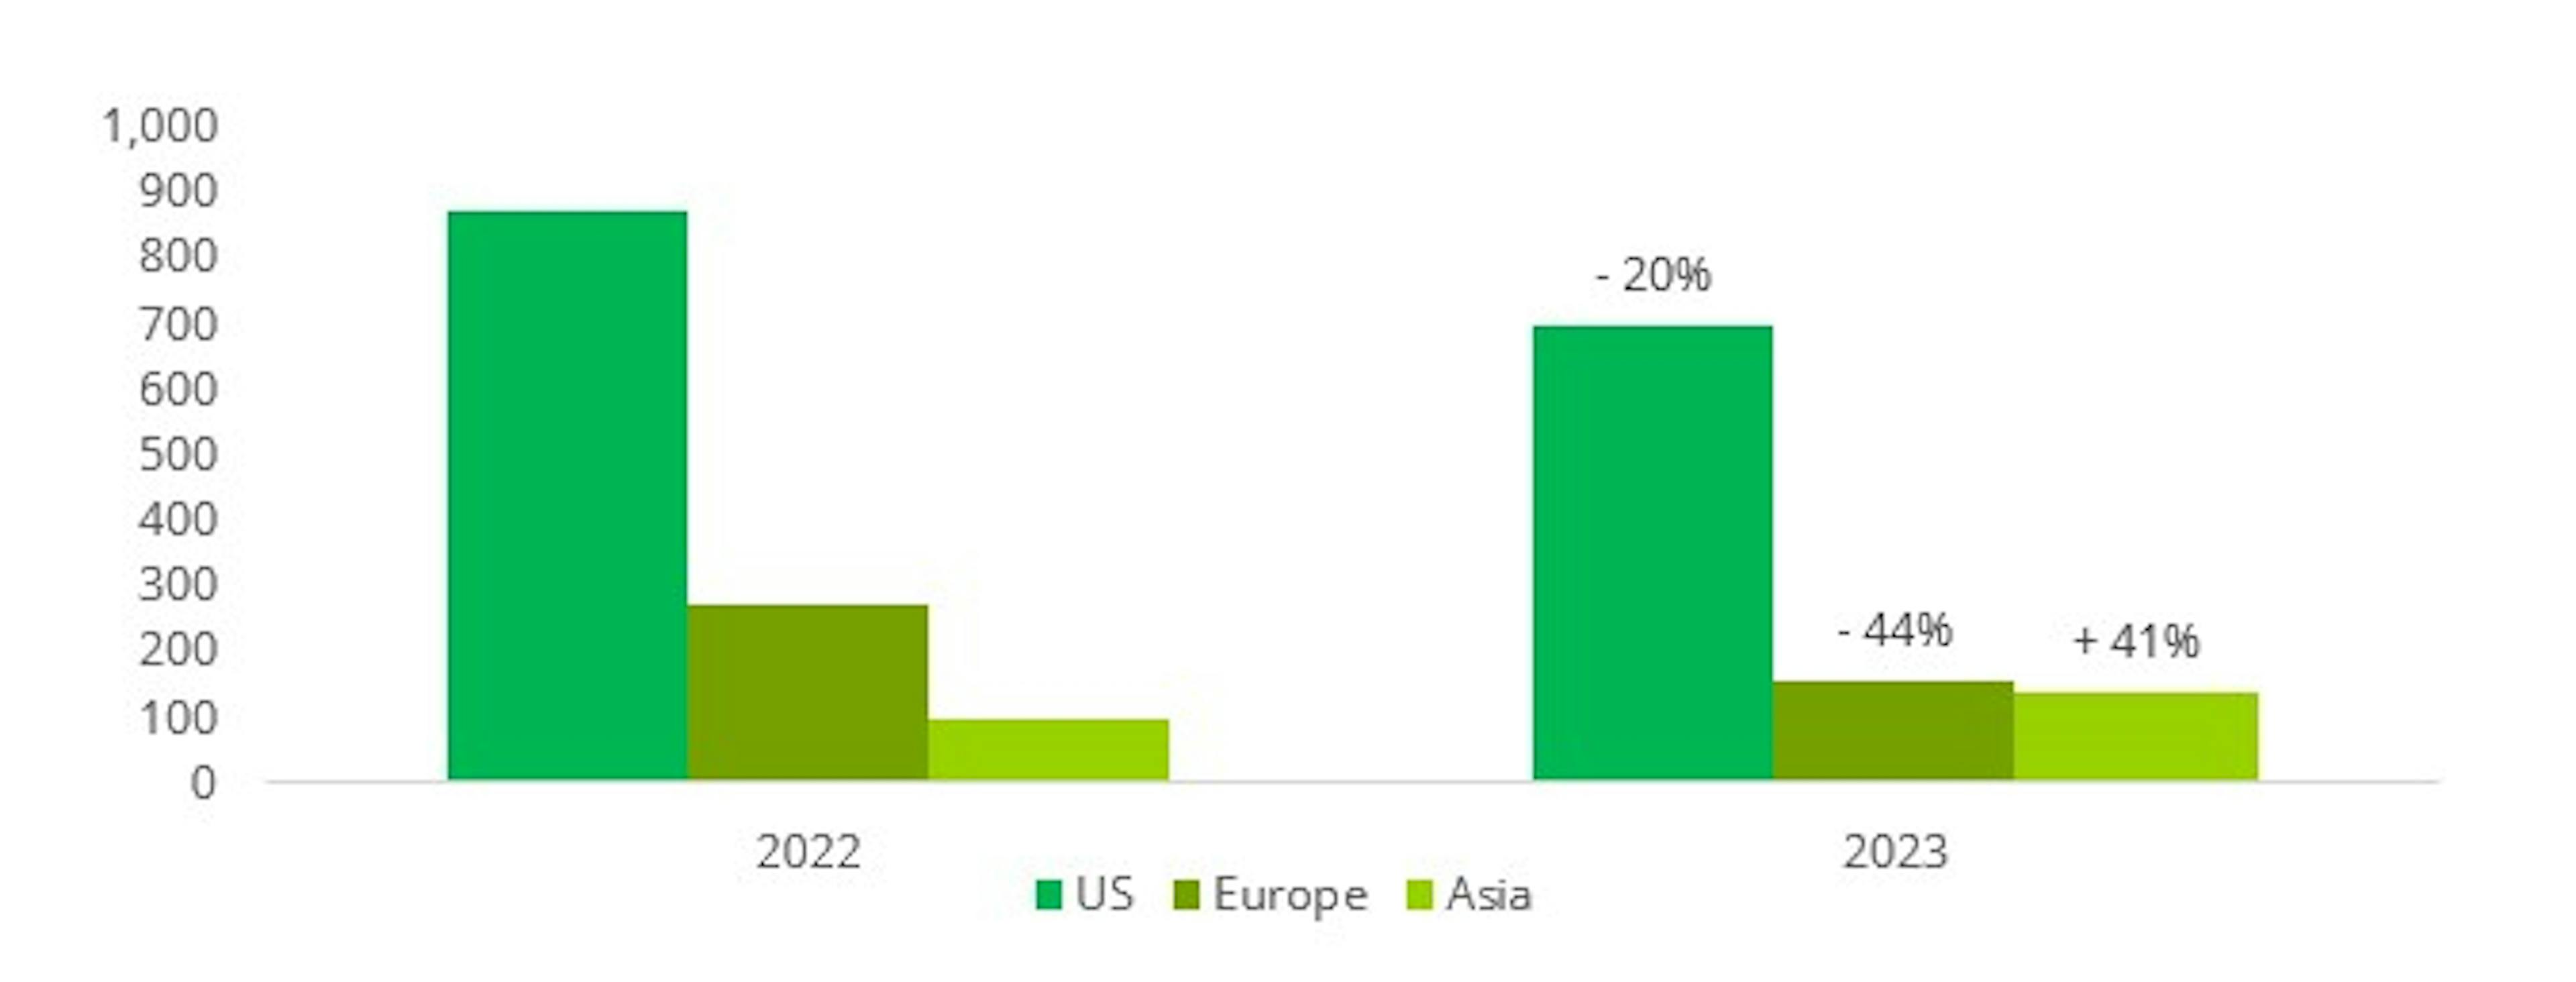
The final quarter is also a good time to take stock of the M&A year that has just ended. At the start of the year, many thought that rising interest rates in the US and Europe would bring M&A activity to a halt. While it is true that there has been a decline in value this year, a detailed analysis reveals a more complex reality. In fact, M&A activity has decreased overall in value in 2023 compared with 2022: deals announced during this year represented a total of $991bn, an annual decline of 20%. There are several points to bear in mind when analysing this figure.
Firstly, this fall is actually smaller than one might have feared at the start of the year, given the scale and speed of the rise in interest rates.
Secondly, the level of activity achieved this year is in line with what was seen on average before 2018, when rates were significantly lower. The geographical disparity is also interesting to note: while the US is down by 20%, Europe is down more sharply by 44%, while Asia is up by 41%.
M&A Activity : Variation of Deal Value 2023 vs 2022 ($bn)
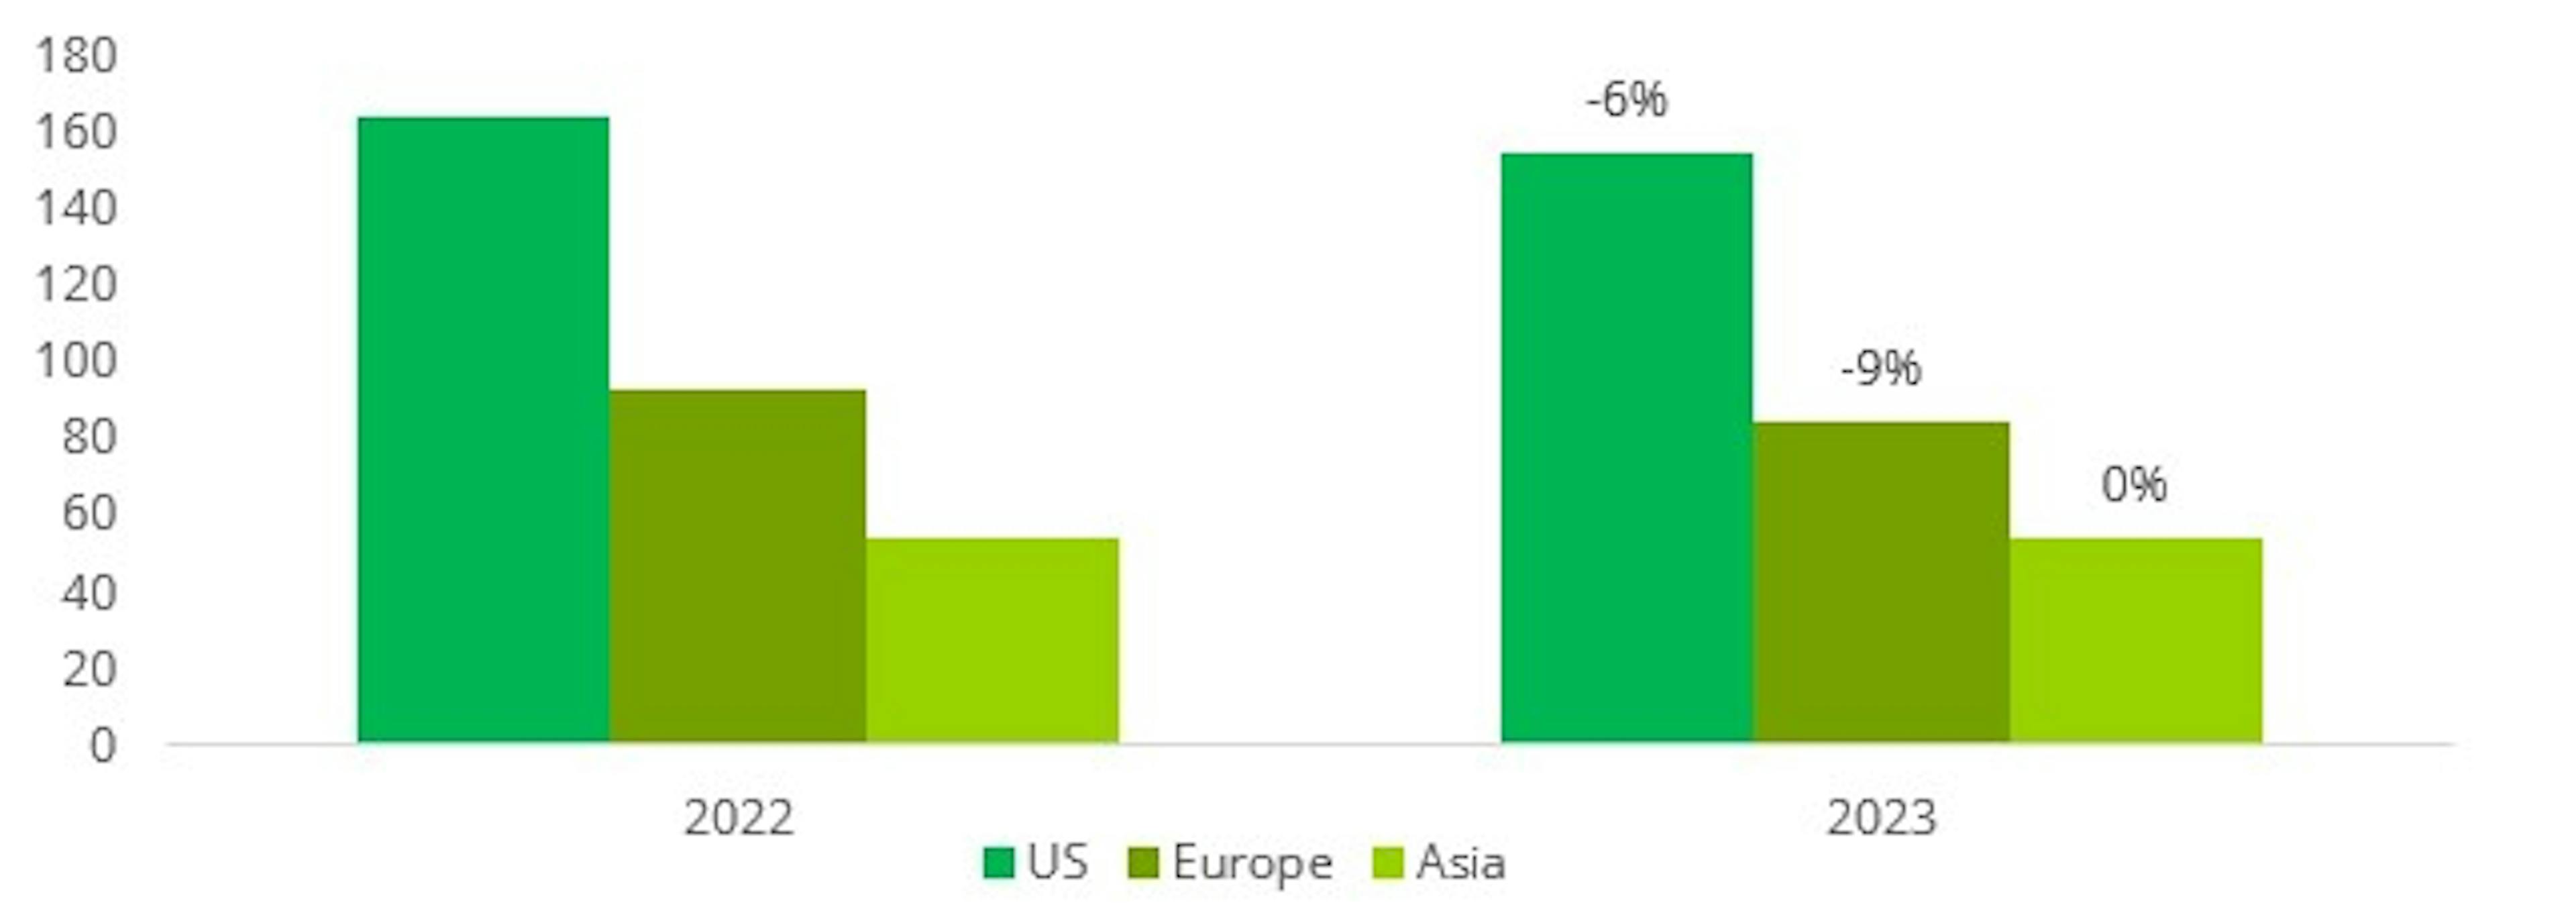
Finally, if we look not at value but at volume, i.e. the number of transactions, the fall in M&A activity is much more modest. With 294 new deals announced for 2023, the fall is only 6% on 2022. This is an important point to emphasise because, for us as arbitrageurs, it is the number of transactions, rather than the size of the deals themselves, that enables us to deploy capital in our funds while maintaining good diversification.
M&A Activity : Variation of Deal Count 2023 vs 2022
The sectoral breakdown of M&A activity is also interesting to analyse, as it reflects a real change from what we have seen in the recent past, and probably foreshadows a new trend for the future.
We are witnessing the return of the "old economy". While Healthcare and Technology remain two important sectors, accounting for 20% and 11% respectively of total announced deals in the US, Energy has become the leading sector with 26% and Industrials/Commodities the third with 14%. In Asia, the trend is even more pronounced, with the Industrial/Raw Materials and Utilities sectors together accounting for almost 70% of the total. The drivers behind this trend are powerful and structural: sector growth driven by the energy transition, a solid balance sheet for strategic players, and significant synergies and economies of scale in the event of mergers.
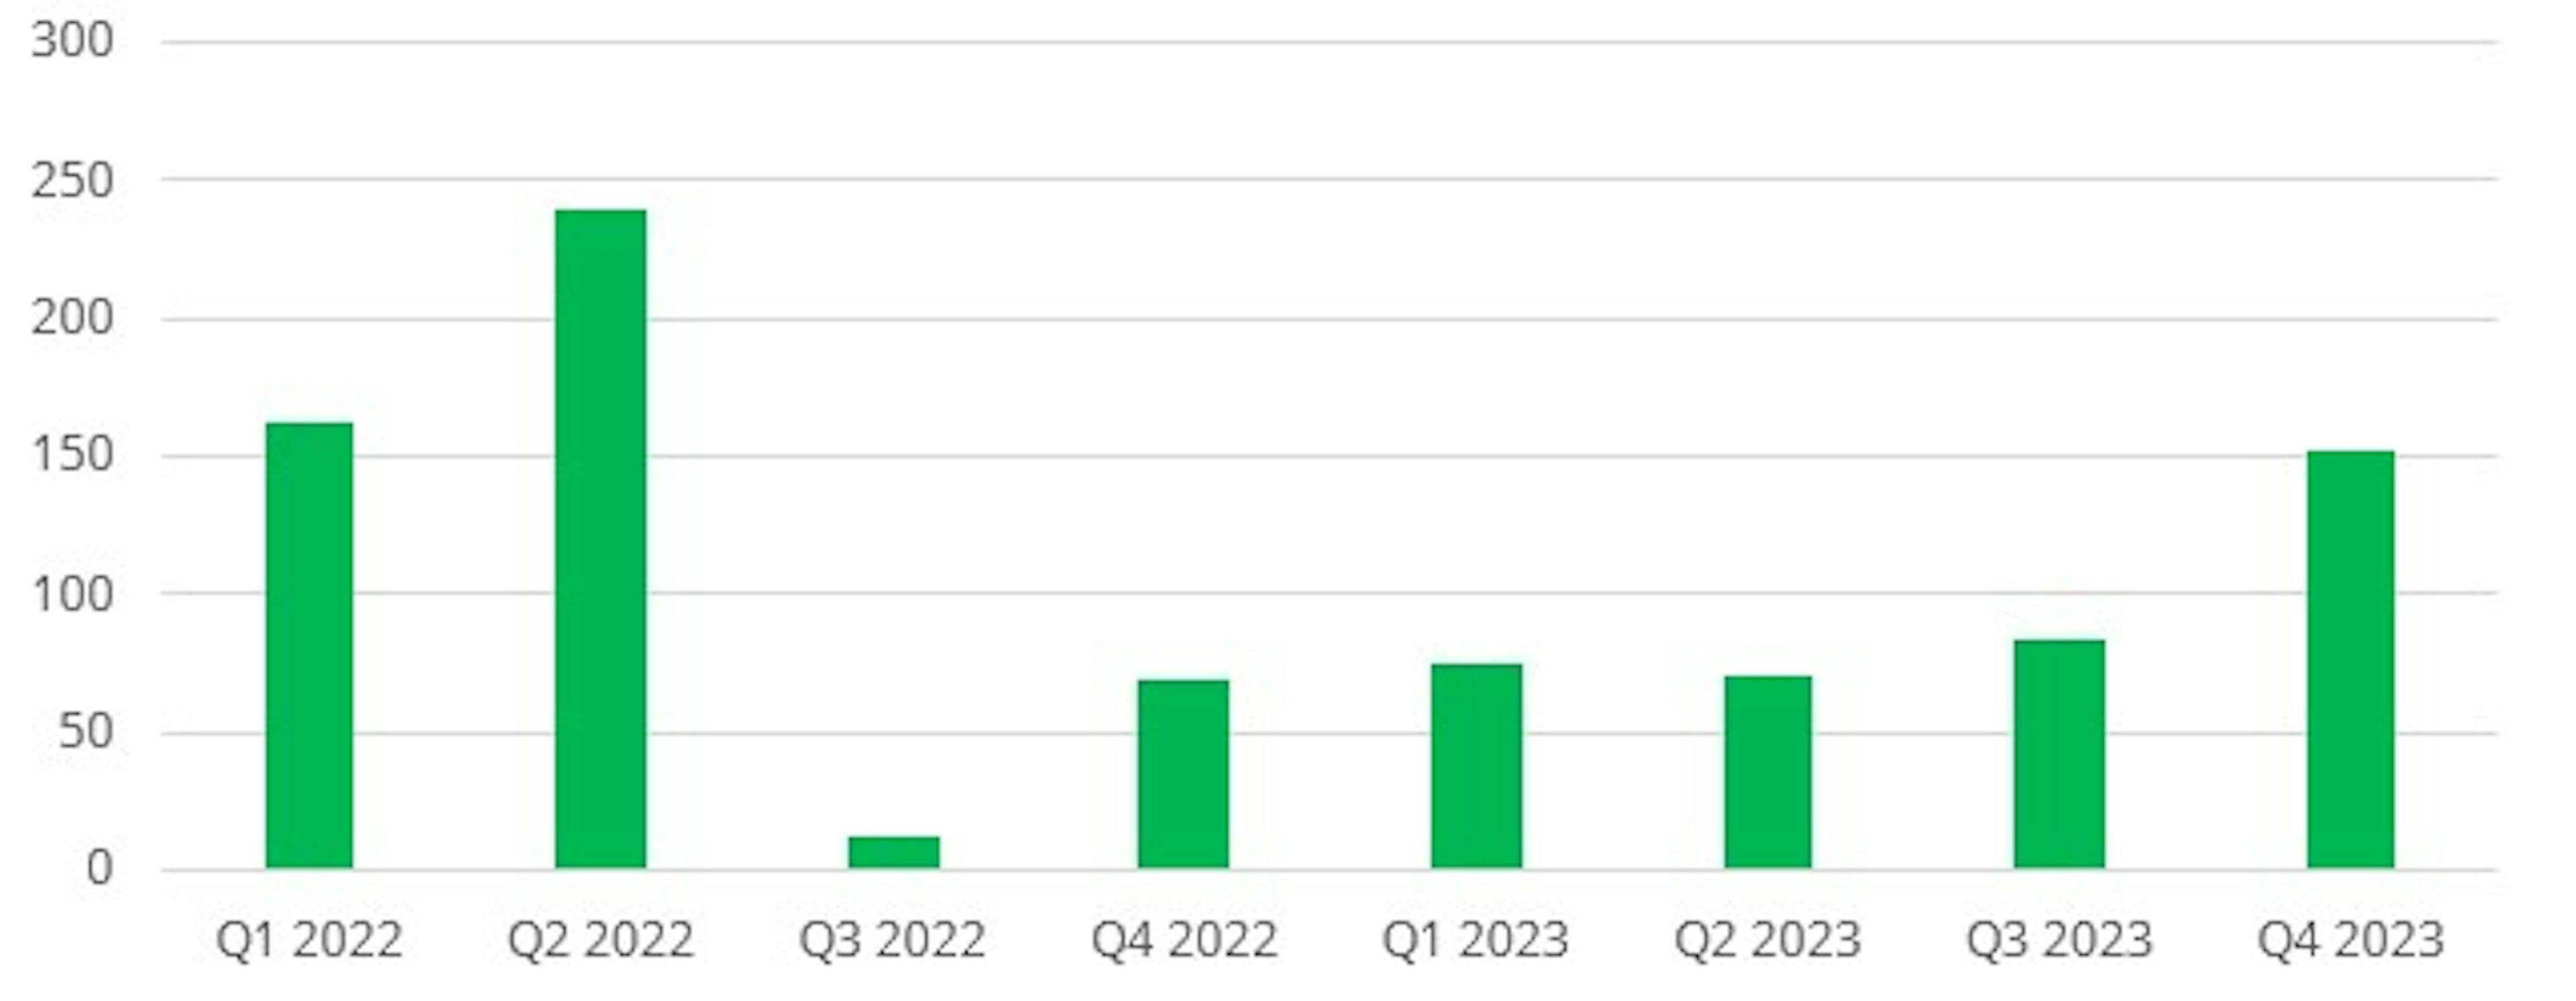
The final highlight of the year is the gradual return of "mega deals" in the US, i.e. deals in excess of $10bn, which had disappeared from the landscape somewhat during 2022. This type of deal had become the Federal Trade Commission’s (FTC) favourite target, particularly in key sectors such as technology (Activision, VMWare, Black Knight) and healthcare (Seagen). But the fact that the FTC failed to block some of these emblematic deals, such as Activision and Seagen, has probably given companies renewed confidence to embark on major external growth projects.
Mega Deals in the US in value ($bn)
With the fall in the US 10-year yield and the prospect of the end of the cycle of key rate hikes, the equity and bond markets rebounded strongly in the last quarter of 2023, with the S&P 500 and US Investment Grade up 11.7% and 10.0% respectively.
Looking at the Merger Arbitrage strategy, our Carmignac Merger Arbitrage (I share class EUR Acc) and Carmignac Merger Arbitrage Plus (I share class EUR Acc) funds posted a more modest increase of 1% and 1.1% respectively, but which remains entirely satisfactory in terms of management objectives. Several factors explain this performance.
Firstly, the pressure from the anti-trust authorities, which we had seen at the start of the year, particularly in the USA, tended to normalise throughout 2023. Two major deals, Pfizer's $41bn takeover of Seagen and Cisco's $28bn acquisition of Splunk, were approved by the FTC during the fourth quarter.
We also benefited from two improved offers. The first was the result of the stock market battle to buy the management company Sculptor Capital between Rithm Capital and a group of investors led by Boaz Weinstein. Rithm Capital's initial offer was eventually increased by almost 14%. The second improved offer concerns the mining company Azure Minerals. Sociedad Quimica y Minera de Chile, a leading Chilean lithium miner, initially launched a standalone offer at AU$3.50, which was subsequently increased by almost 6% with the support of Australian company Hancock Prospecting.
Finally, a large number of transactions, 88 in total in the US, came to an end during the quarter. The convergence of discounts on these deals was a good performance driver at the end of the year.
On the other hand, several factors had a negative impact on the fund's performance during the quarter.
While the FTC approved a number of major deals, it also launched in-depth investigations into two other transactions, Tapestry's acquisition of Capri Holdings in the luxury handbag sector and Campbell Soup's acquisition of Sovo in the food sector. Although partly anticipated by the market, this bad news led to a widening of the two discounts, creating greater volatility.
The other negative factor of the month was the high volatility of discounts in the oil sector, particularly the one on the Hess/Chevron deal. Tensions between Venezuela and Guyana escalated in December over the territorial dispute centred on the Essequibo region. After holding a referendum on Venezuelan sovereignty over the Essequibo, Venezuela launched a defensive military manoeuvre on the border between the two countries. As Hess holds the vast majority of its assets in Guyana, the discount on the deal initially fell sharply before tightening at the end of the month following a meeting between the Venezuelan and Guyanese heads of state mediated by Brazil. We note that the merger agreement between Hess and Chevron is extremely strong and that the escalation of tensions alone cannot be a sufficient reason to withdraw from this operation. Chevron has also reaffirmed its interest in acquiring Hess.
Finally, despite significant improvements, Brookfield and EIG Global Energy's bid for Australian power producer Origin Energy failed as a result of shareholder opposition led by the Australian Super pension fund. As we had correctly estimated the Origin Energy share price in the event of the deal failing, the impact on performance was limited.
Another way of breaking down the fund's performance is to look at the status of the deal at the end of the period. A bid can be either:
- In progress: the deal has not yet been finalised because all the conditions precedent have not yet been lifted.
- Closed: the transaction has been finalised in accordance with the initial terms.
- Improved: the buyer has increased its price or a third party has come in with a higher offer.
- Abandoned: the deal failed.
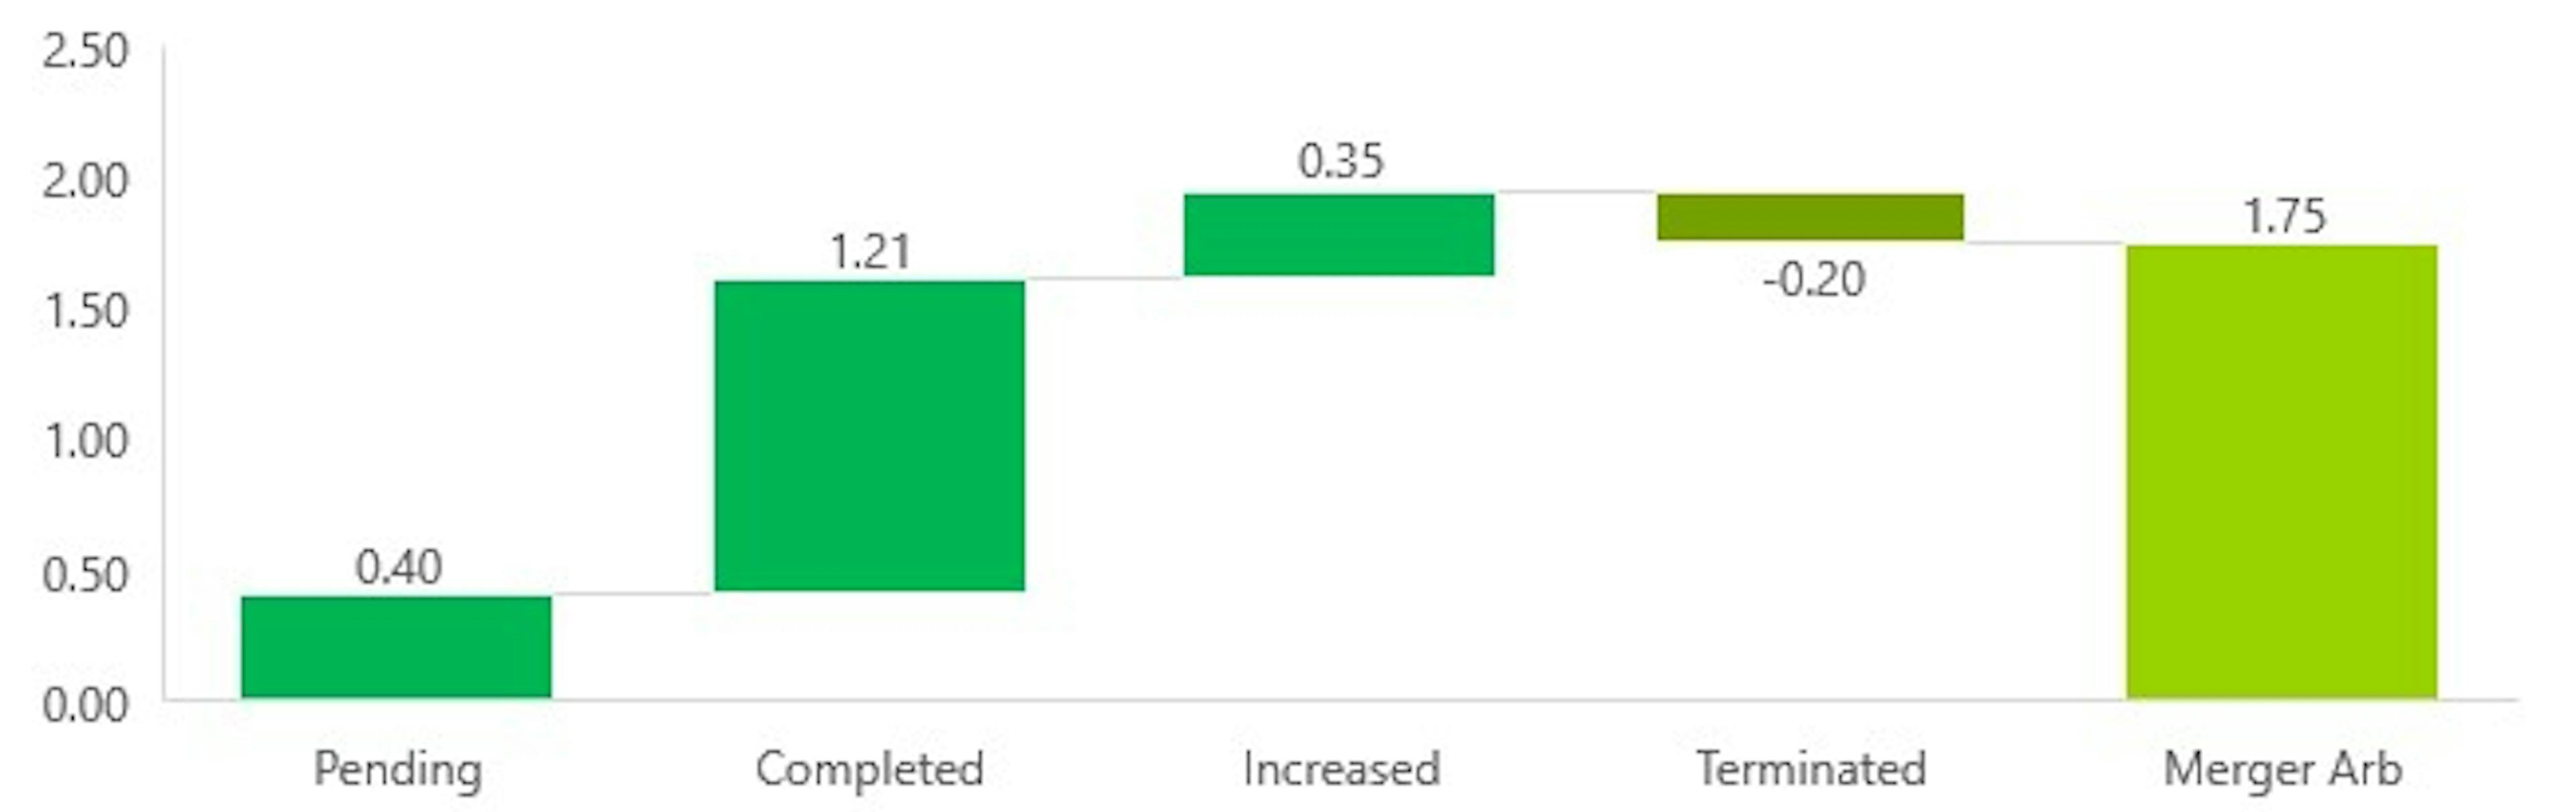
Using this methodology, we obtain the following performance attribution table for Carmignac Portfolio Merger Arbitrage Plus:
Merger Arb gross performance attribution in Q4 2023
The table for Carmignac Portfolio Merger Arbitrage is as follows:
Merger Arb gross performance attribution in Q4 2023
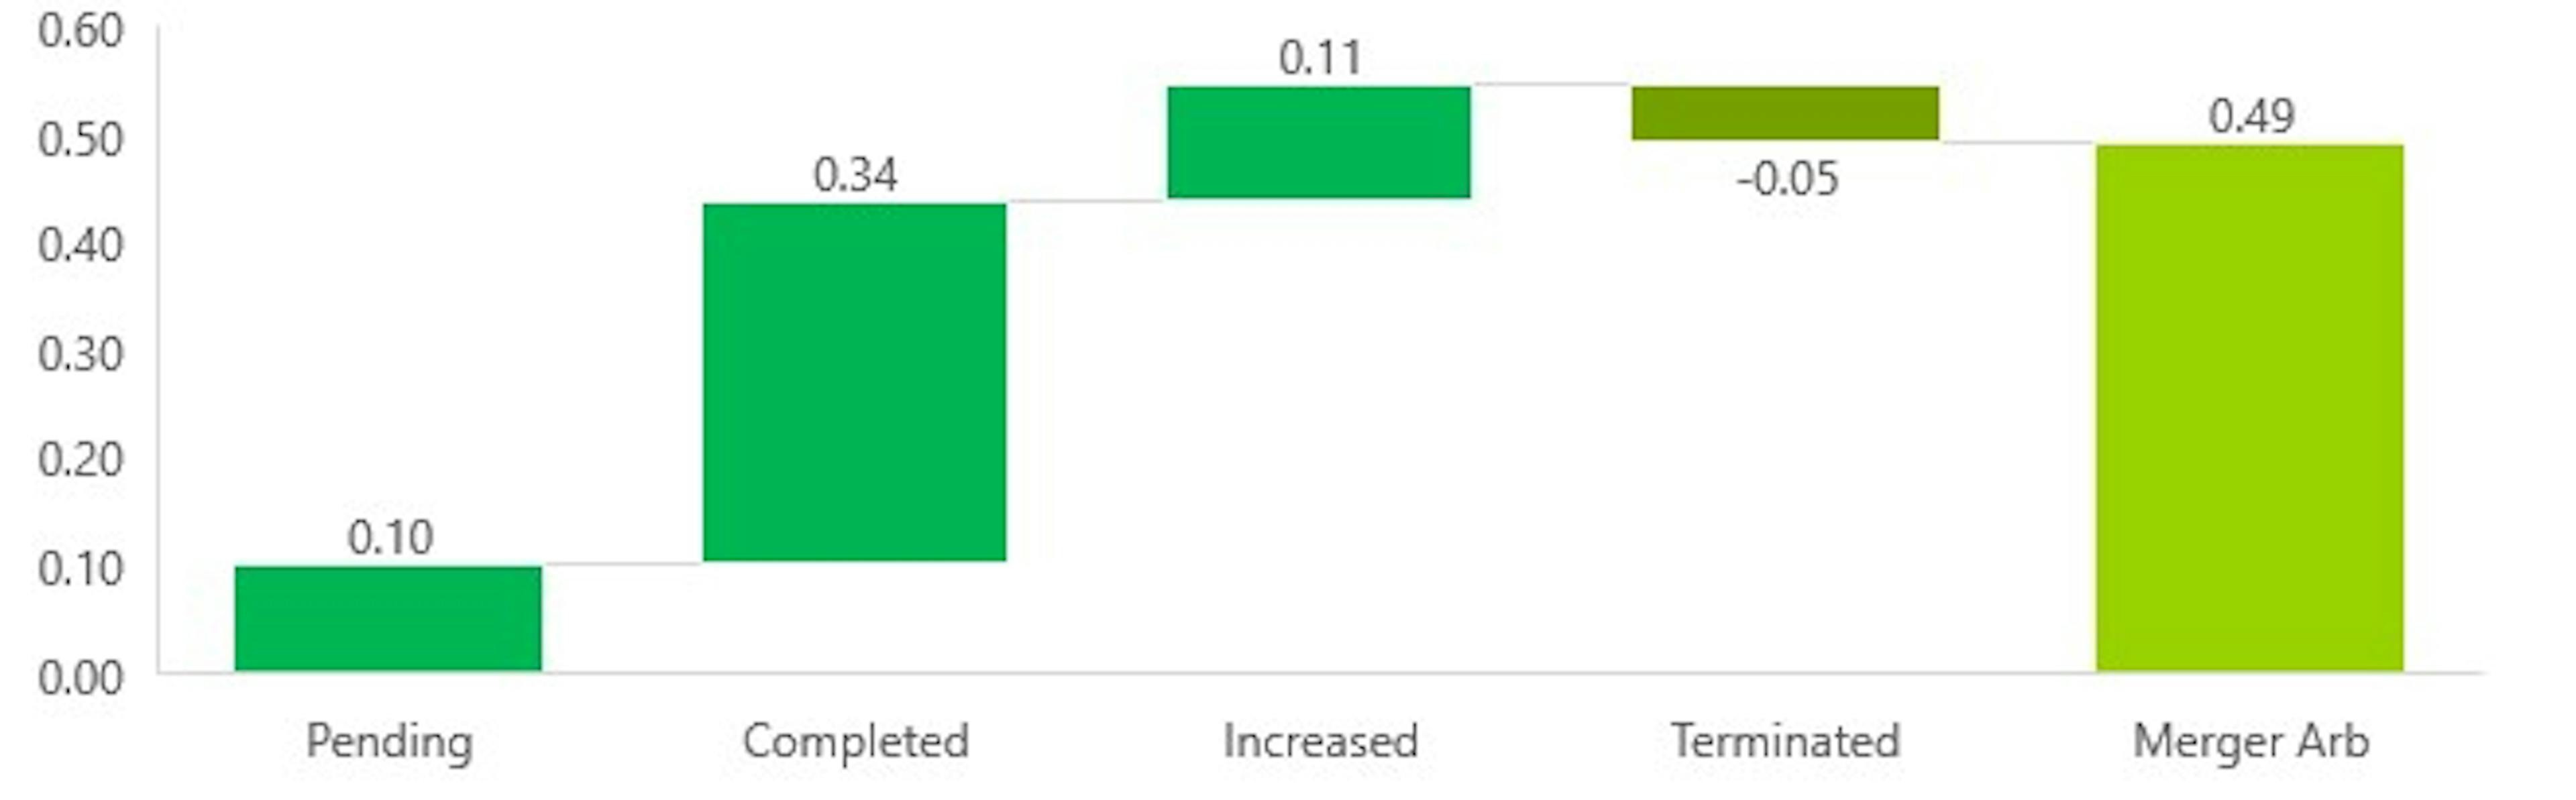
The main driver of performance was the completion of a large number of transactions in the portfolio. Given the increased volatility on certain discounts such as Sovo, Capri and Hess, the 'Pending' category contributed little to performance during the quarter. It should also be noted that the failure of the Origin Energy deal was more than offset by improved offers, notably the one for Sculptor.
This year end is also an opportunity to take stock, since the funds were created in April 2023, of the two other key management parameters: volatility and correlation with the main asset classes.
In a year that was ultimately turbulent for all markets, our Merger Arbitrage strategy delivered on its promise of controlled volatility and low correlation. Carmignac Portfolio Merger Arbitrage has a volatility of 0.7% and a correlation to equities of 0.24 and High Yield credit of 0.12.
Carmignac Portfolio Merger Arbitrage Plus has a volatility of 2.1% and a correlation to equities of 0.26 and to High Yield credit of 0.14.
For the year ahead, we are confident that the good momentum seen in Q4 2023 will continue. Indeed, a historical study of M&A activity shows that, while there is a degree of cyclicality, downturns in activity tend on average to be short-lived. For 2024, the drivers of the recovery are already there:
- The end of the rate hike cycle is approaching, which should give business leaders a degree of visibility.
- Return of mega deals in most economic sectors.
- Sectoral shift in M&A activity towards the "old economy", driven in particular by the energy transition.
- A greater proportion of strategic players than financial players, who are more penalised by high interest rates.
- In some sectors, such as technology and healthcare, external growth is structurally an integral part of development models.
The Merger Arbitrage Team

Carmignac Portfolio Merger Arbitrage
A defensive strategy focusing on merger arbitrage opportunitiesDiscover the fund pageCarmignac Portfolio Merger Arbitrage I EUR Acc
- Empfohlene Mindestanlagedauer
- 3 Jahre
- Risikoskala*
- 2/7
- SFDR-Klassifizierung**
- Artikel 8
*Risiko Skala von KID (Basisinformationsblatt). Das Risiko 1 ist nicht eine risikolose Investition. Dieser Indikator kann sich im Laufe der Zeit verändern. **Die Offenlegungsverordnung (Sustainable Finance Disclosure Regulation - SFDR) 2019/2088 ist eine europäische Verordnung, die Vermögensverwalter dazu verpflichtet, ihre Fonds u. a. als solche zu klassifizieren: „Artikel 8“ - Förderung ökologischer und sozialer Eigenschaften; „Artikel 9“ - Investitionen mit messbaren Zielen nachhaltig machen; bzw. „Artikel 6“ - keine unbedingten Nachhaltigkeitsziele. Weitere Informationen finden Sie unter: https://eur-lex.europa.eu/eli/reg/2019/2088/oj?locale=de.
Hauptrisiken des Fonds
Kosten
- Einstiegskosten
- Wir berechnen keine Einstiegsgebühr.
- Ausstiegskosten
- Wir berechnen keine Ausstiegsgebühr für dieses Produkt.
- Verwaltungsgebühren und sonstige Verwaltungs- oder Betriebskosten
- 0,62% des Werts Ihrer Anlage pro Jahr. Hierbei handelt es sich um eine Schätzung auf der Grundlage der tatsächlichen Kosten des letzten Jahres.
- Erfolgsgebühren
- 20,00% wenn die Anteilsklasse während des Performancezeitraums den Referenzindikator übertrifft. Sie ist auch dann zahlbar, wenn die Anteilsklasse den Referenzindikator übertroffen, aber eine negative Performance verzeichnet hat. Minderleistung wird für 5 Jahre zurückgefordert. Der tatsächliche Betrag hängt davon ab, wie gut sich Ihre Investition entwickelt. Die obige aggregierte Kostenschätzung enthält den Durchschnitt der letzten 5 Jahre oder seit der Produkterstellung, wenn es weniger als 5 Jahre sind.
- Transaktionskosten
- 0,30% des Werts Ihrer Anlage pro Jahr. Hierbei handelt es sich um eine Schätzung der Kosten, die anfallen, wenn wir die Basiswerte für das Produkt kaufen oder verkaufen. Der tatsächliche Betrag hängt davon ab, wie viel wir kaufen und verkaufen.
Annualisierte Performance
| Carmignac Portfolio Merger Arbitrage | 2.7 |
| Carmignac Portfolio Merger Arbitrage | - | - | + 3.8 % |
Quelle: Carmignac am 28 März 2024.
Die Wertentwicklung der Vergangenheit ist keine Garantie für die zukünftige Wertentwicklung. Die hier dargestellte Performance des Fonds beinhaltet alle jährlich auf Fondsebene anfallenden Kosten. Um den dargestellten Anlagebetrag von EUR 100 zu erreichen, hätte ein Anleger bei Erhebung eines Ausgabeaufschlags von X% XXX,XX EUR aufwenden müssen. Eventuell beim Anleger anfallende Depotgebühren würden das Anlageergebnis mindern.
Aktuelle Analysen
![[Background image] [CI] Blue sky and buildings](https://carmignac.imgix.net/uploads/article/0001/05/CI_WEB.jpg?auto=format%2Ccompress&fit=fill&w=3840)
Fonds-Update – Carmignac Investissement


Fonds-Update – Carmignac Patrimoine
Marketing-Anzeige. Bitte lesen Sie den KID /Prospekt bevor Sie eine endgültige Anlageentscheidung treffen. Dieses Dokument ist für professionelle Kunden bestimmt.
Diese Unterlagen dürfen ohne die vorherige Genehmigung der Verwaltungsgesellschaft weder ganz noch in Auszügen reproduziert werden. Diese Unterlagen stellen weder ein Zeichnungsangebot noch eine Anlageberatung dar. Diese Unterlagen stellen keine buchhalterische, rechtliche oder steuerliche Beratung dar und sollten nicht als solche herangezogen werden. Diese Unterlagen dienen ausschließlich zu Informationszwecken und dürfen nicht zur Beurteilung der Vorzüge einer Anlage in Wertpapieren oder Anteilen, die in diesen Unterlagen genannt werden, oder zu anderen Zwecken herangezogen werden. Die in diesen Unterlagen enthaltenen Informationen können unvollständig sein und ohne vorherige Mitteilung geändert werden. Sie entsprechen dem Stand der Informationen zum Erstellungsdatum der Unterlagen, stammen aus internen sowie externen, von Carmignac als zuverlässig erachteten Quellen und sind unter Umständen unvollständig. Darüber hinaus besteht keine Garantie für die Richtigkeit dieser Informationen. Dementsprechend wird die Richtigkeit und Zuverlässigkeit dieser Informationen nicht gewährleistet und jegliche Haftung im Zusammenhang mit Fehlern und Auslassungen (einschließlich der Haftung gegenüber Personen aufgrund von Nachlässigkeit) wird von Carmignac, dessen Niederlassungen, Mitarbeitern und Vertretern abgelehnt.
Wertentwicklungen der Vergangenheit lassen keine Rückschlüsse auf zukünftige Wertverläufe zu. Wertentwicklung nach Gebühren (keine Berücksichtigung von Ausgabeaufschlägen die durch die Vertriebsstelle erhoben werden können)
Die Rendite von Anteilen, die nicht gegen das Währungsrisiko abgesichert sind, kann infolge von Währungsschwankungen steigen oder fallen.
Die Bezugnahme auf bestimmte Werte oder Finanzinstrumente dient als Beispiel, um bestimmte Werte, die in den Portfolios der Carmignac-Fondspalette enthalten sind bzw. waren, vorzustellen. Hierdurch soll keine Werbung für eine Direktanlage in diesen Instrumenten gemacht werden, und es handelt sich nicht um eine Anlageberatung. Die Verwaltungsgesellschaft unterliegt nicht dem Verbot einer Durchführung von Transaktionen in diesen Instrumenten vor Veröffentlichung der Mitteilung. Die Portfolios der Carmignac-Fondspalette können ohne Vorankündigung geändert werden.
Der Verweis auf ein Ranking oder eine Auszeichnung, ist keine Garantie für die zukünftigen Ergebnisse des OGAW oder des Managers.
Risiko Skala von KID (Basisinformationsblatt). Das Risiko 1 ist nicht eine risikolose Investition. Dieser Indikator kann sich im Laufe der Zeit verändern. Die empfohlene Anlagedauer stellt eine Mindestanlagedauer dar und keine Empfehlung, die Anlage am Ende dieses Zeitraums zu verkaufen.
Morningstar Rating™ : © Morningstar, Inc. Alle Rechte vorbehalten. Die hierin enthaltenen Informationen: sind für Morningstar und/oder ihre Inhalte-Anbieter urheberrechtlich geschützt; dürfen nicht vervielfältigt oder verbreitet werden; und deren Richtigkeit, Vollständigkeit oder Aktualität wird nicht garantiert. Weder Morningstar noch deren Inhalte-Anbieter sind verantwortlich für etwaige Schäden oder Verluste, die aus der Verwendung dieser Informationen entstehen.
Bei der Entscheidung, in den beworbenen Fonds zu investieren, alle Eigenschaften oder Ziele des beworbenen Fonds berücksichtigt werden sollten, wie sie in seinem Prospekt oder in den Informationen beschrieben sind. Der Zugang zu den Fonds kann für bestimmte Personen oder Länder Einschränkungen unterliegen. Diese Unterlagen sind nicht für Personen in Ländern bestimmt, in denen die Unterlagen oder die Bereitstellung dieser Unterlagen (aufgrund der Nationalität oder des Wohnsitzes dieser Person oder aus anderen Gründen) verboten sind. Personen, für die solche Verbote gelten, dürfen nicht auf diese Unterlagen zugreifen. Die Besteuerung ist von den jeweiligen Umständen der betreffenden Person abhängig. Die Fonds sind in Asien, Japan und Nordamerika nicht zum Vertrieb an Privatanleger registriert und sind nicht in Südamerika registriert. Carmignac-Fonds sind in Singapur als eingeschränkte ausländische Fonds registriert (nur für professionelle Anleger). Die Fonds wurden nicht gemäß dem „US Securities Act“ von 1933 registriert. Gemäß der Definition der US-amerikanischen Verordnung „US Regulation S“ und FATCA dürfen die Fonds weder direkt noch indirekt zugunsten oder im Namen einer „US-Person“ angeboten oder verkauft werden. Die Risiken, Gebühren und laufenden Kosten sind in den wesentlichen Anlegerinformationen (Basisinformationsblatt, KID) beschrieben. Die wesentlichen Anlegerinformationen müssen dem Zeichner vor der Zeichnung ausgehändigt werden. Der Zeichner muss die wesentlichen Anlegerinformationen lesen. Anleger können einen teilweisen oder vollständigen Verlust ihres Kapitals erleiden, da das Kapital der Fonds nicht garantiert ist. Die Fonds sind mit dem Risiko eines Kapitalverlusts verbunden. Die Verwaltungsgesellschaft kann den Vertrieb in Ihrem Land jederzeit einstellen.
Carmignac Portfolio bezieht sich auf die Teilfonds der Carmignac Portfolio SICAV, einer Investmentgesellschaft luxemburgischen Rechts, die der OGAW-Richtlinie oder AIFM- Richtlinie entspricht.Bei den Fonds handelt es sich um Investmentfonds in der Form von vertraglich geregeltem Gesamthandseigentum (FCP), die der OGAW-Richtlinie nach französischem Recht entsprechen.
Für Deutschland: Die Prospekte, KID und Jahresberichte des Fonds stehen auf der Website www.carmignac.de zur Verfügung und sind auf Anforderung bei der Verwaltungsgesellschaft bzw. Die Anleger können eine Zusammenfassung ihrer Rechte auf Deutsch unter dem folgenden Link abrufen Absatz 6.
- Für Osterreich: Die Prospekte, KID und Jahresberichte des Fonds stehen auf der Website www.carmignac.at zur Verfügung und sind auf Anforderung bei der Erste Bank der österreichischen Sparkassen AG OE 01980533/ Produktmanagement Wertpapiere, Petersplatz 7, 1010 Wien, erhältlich. Die Anleger können eine Zusammenfassung ihrer Rechte auf Deutsch unter dem folgenden Link abrufen Absatz.
- In der Schweiz: die Prospekte, KID und Jahresberichte stehen auf der Website www.carmignac.ch zur Verfügung und sind bei unserem Vertreter in der Schweiz erhältlich, CACEIS (Switzerland), S.A., Route de Signy 35, CH-1260 Nyon. Die Zahlungsdienst ist die CACEIS Bank, Montrouge, Zweigniederlassung Nyon / Schweiz Route de Signy 35, 1260 Nyon. Die Anleger können eine Zusammenfassung ihrer Rechte auf Deutsch unter dem folgenden Link abrufen Absatz 6.